Harvard Essay On Social And Geographical Factors In Uk's 2016 Brexit
In 2016, the British rolled out a nationwide campaign for a referendum dubbed Brexit. It sought to inquire from the electorates whether they thought that it was fit for the United Kingdom to continue being a member of the European Union or exit from the formation. The country was not a founding member of the E.U., but had with other countries in 1973. It had remained a loyal and active member until when the citizens voted in favour of Brexit. The campaign period was so heated, with leaders giving varied opinions concerning the referendum. Some urged the voters to vote against E.U. membership, while others warned that such a move could have dire consequences to the economy and wellbeing of the nation (Becker et al., 2017). However, Great Britain citizens opted to leave the E.U. in a very close ballot. The turnout was described as the highest ever witnessed in U.K. polls since 1992 (Hobolt, 2016). Conservative party spearheaded the call for poll posing the question on whether citizens found it fit for the country to continue being a member of the E.U. Some people led by Gove and Stuart were optimistic that leaving the E.U. would leave the country with more bargaining powers. In contrast, others posit that remaining and actively participating in the E.U. would make the country secure (Boyle et al., 2018). Many people were afraid after the results were announced due to the fear for dire consequences of the move. Several geographical and social aspects can be used to explain the results of the Brexit referendum.
It is essential to review some of the reasons that drove the majority of the British to vote in support of parting with the E.U. so that the political changes that they look forward to now could be undeerstood. The poll was conducted on 23rd June 2016, where 51.9 per cent of total votes cast answered no to the referendum question (Hobolt, 2016; Clarke et al., 2017). The question posed was whether the UK should have remained an active member of the European Union. Various studies have been conducted to analyze how electorates voted and reasons behind their decisions since 2016 (Becker et al., 2017). There are geographical factors that have been analyzed, showing that some regions voted more in support or against the E.U. exit. Social aspects such as age and ethnicity were also at play in influencing the decision made in 2016 (Dhingra et al., 2016). Immigration control issues and the cost of remaining as members or exiting the E.U. were also the critical aspects throughout the campaigning period. Some citizens, especially older people, felt that being part of the union denied them a sense of national identity that existed before the country joined the E.U. (Becker et al., 2017). Younger people feared how the state would stand-alone since they had never seen that happen in their lifetime. Some people also thought that if the country left membership of the union, they would be able to control illegal immigration and their economy (Matti and Zhou, 2017). Most people that raised the issue were dwellers of improvised towns. The majority of citizens of the United Kingdom voted to exit the E.U. in line with social and geographical factors.
Social Factors
Education qualification and income of voters determined how they voted in the Brexit referendum. Individuals with lower educational standards mostly favoured an exit from the union than those with high qualifications (Becker et al., 2017). Areas where people are believed to be more educated had a higher percentage of people who voted against the idea of quitting from the E.U. More than 60 per cent of people with post-graduate degrees voted for the U.K. to continue partnering with other countries in the E.U., while those without degrees reported more than 70 per cent support for exit (Henderson et al., 2017). Personal income and social class factors also influenced the decision of many voters. People with high earning and prestigious job positions were more probable to select against the referendum, whereas low-income earners and casual workers wanted Britain out of the union (Boyle et al., 2018). Managers and professionals reportedly showed the highest support to the campaign and voting for the country to continue participating in European Union affairs. Unskilled labourers and skilled manual workers, however, recorded more than 70 per cent support for the Brexit (Tilford, 2015). The majority of people who depend on the country's support in receiving social services such as health and education did not find any benefit accrued from the country's membership in the E.U. Some people were convinced that their nation could do better in addressing social inequalities and low pay if it was not operating under the union. Education, income, and social class of citizens in the U.K., therefore, influenced the 2016 poll.
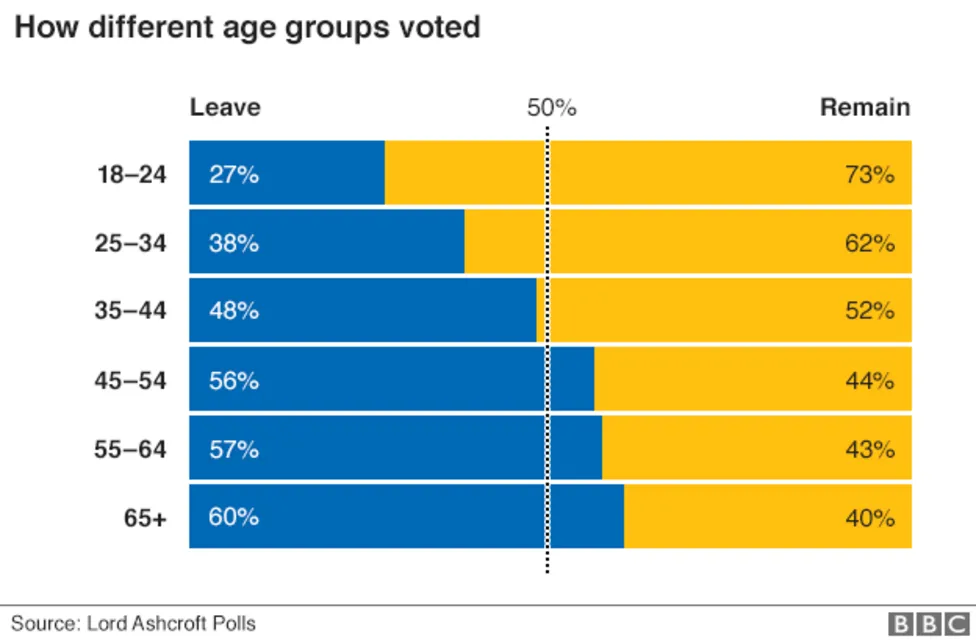
Age and ethnicity have also been classified as vital factors during the Brexit referendum. The majority of supporters for the leaving campaign were people aged more than 65 years, with more than 60 per cent of them wishing to exit (Matti and Zhou, 2017). The younger people had contrasting opinions regarding the idea of leaving the union. It is estimated that 73 per cent of young people aged between 18 to 24 years wished that the nation would continue being part of the E.U. for long (BBC News, 2016). Areas such as East Coast are known to have the most substantial pensioner populace, and consistently, Brexit votes were higher in the region. The variation in the ballots has been regarded as a generation gap factor in the Brexit campaigns.

Figure 1: Voting as per Age Group (BBC News, 2016)
It is evident from the bar graph that the older a person was, the more probably he or she was to support Brexit. It is assumed that young people were afraid of how the country could survive after losing membership, but older people had some experience before the country joined the European Union (Matti and Zhou, 2017). Other citizens were influenced in their decision by ethnicity or religious factors. The majority of Whites were satisfied with the leaving mode, while people of colour were opposed to the exit (Becker et al., 2017). Whites' support for the Brexit is related to a sense of national identity. Therefore, it is evident that many social factors were at play during the campaign and actual voting during the referendum.
Geographical Factors
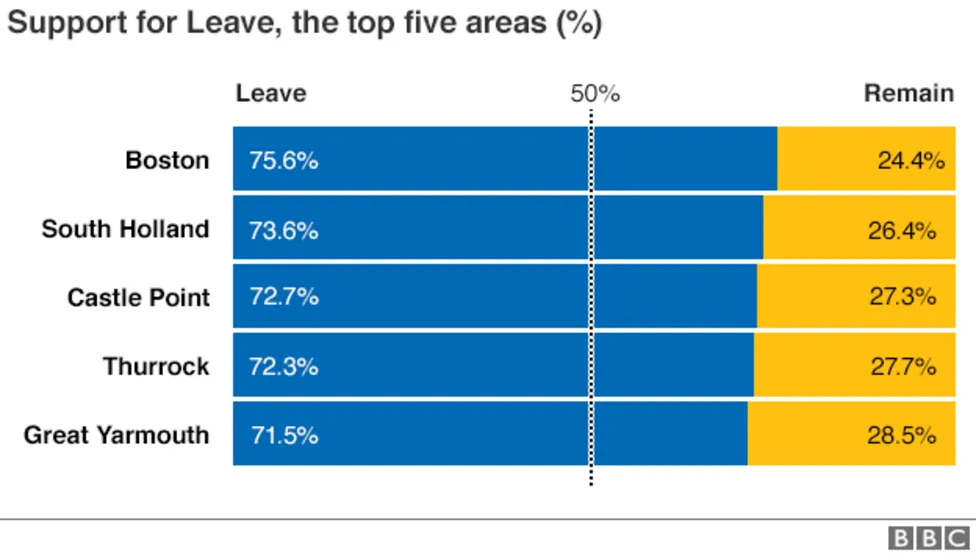
The 2016 Brexit vote revealed various geographical issues in the UK. The distribution of votes was not evenly distributed across UK (Henderson et al., 2017). Many people were left wondering whether the country was still united. Some political ideologies always take regional direction owing it to some economic imbalances and other social factors in the nation. The United Kingdom has remained united for more than three hundred centuries now, but Brexit campaigns revealed harsh realities that the spirit of nationalism has never been fully embraced (Tilford, 2015). People sometimes express inequalities and varied interest issues as the major factors that promote division within the country. The total number of areas where the vote was conducted was 339, where 270 supported the idea of exiting from the EU, and the rest voted that the UK should remain part of the union (Clarke et al., 2017). Many votes that called for the exit came from England and Wales. Leaders in these two areas who supported the departure managed to convince the majority of the populace in the northern cities and south of England to support their course. Boston had the highest number of residents who called for an exit from the E.U., with over 75 per cent votes, as shown in the bar graph table below (BBC News, 2016). Castle point, Great Yarmouth, South Holland, and Thurrock followed suit with all of them recording the highest support for Brexit.

Figure 2: The Top Areas that Recorded highest votes in favour of Brexit (BBC News, 2016)
England and Wales were the strongholds for leave votes during the 2016 referendum poll. London money machine is believed to have influenced their choice in a significant way, especially for people with low income (Becker et al., 2017). People in these areas felt that there was high inequality justified against them and needed a revolution against the status quo. They saw the Brexit vote as the avenue to express their concerns and therefore had to make their stance understood (Hobolt, 2016). It was class conflict dubbed South-East against the rest of the country that made it easier for the Brexit quest to succeed. The exit vote was prompted by these underlying factors, which included immigration discontentment and London dominance (Boyle et al., 2018). Other factors revolved around the social factors analyzed above and areas of reference most affected. There are, for example, areas where the rate of literacy is considered low, and hence they recorded a high number of individuals supporting the exit move. The finding, however, has been challenged by some individuals arguing that Scotland has some areas with the highest number of people with low educational qualifications but mostly voted against the UK exiting from the European Union (Boyle et al., 2018). It, therefore, shows that they were other factors of consideration by the electorates, which made them make the decision they made in 2016 (Boyle et al., 2018). The sense of inequality in some areas and the desire to be heard were majorly the influencers of geographical disparities in voting for Brexit.
Conclusion
The outcome of the Brexit referendum can be attributed to both social and geographical factors. The campaigning period was very heated, with leaders giving varied opinions on what they thought was the best option for the country. The poll was conducted in June 2016, and the majority voted in favour of Brexit. Some people feared that the move could lead to dire consequences, while others were optimistic that the U.K would become more robust and address some issues that angered a section of citizens. Geographical and social factors can be identified with closer analysis of votes cast either for exit or to oppose the change. Income and education levels of citizens are examples of societal issues that influenced the voting. People with high educational qualifications were not pleased by the idea of leaving the EU while those without voted against membership. Age and ethnicity were also at play since younger people, as well as people of colour, found it unwise for UK to withdraw from the EU. The distribution of votes for either side was also not evenly distributed, which served as evidence that geographical factors were at play. People in some regions used the opportunity to show their resentment for inequality or other issues hence influencing their take in the Brexit referendum.
References
BBC News, 2016. E.U. referendum: the result in maps and charts, https://www.bbc.com/news/uk-politics-36616028
Becker, S.O., Fetzer, T. and Novy, D., 2017. Who voted for Brexit? A comprehensive district-level analysis. Economic Policy, 32(92), pp.601-650.
Boyle, M., Paddison, R. and Shirlow, P., 2018. Introducing 'Brexit Geographies': five provocations.
Clarke, H.D., Goodwin, M. and Whiteley, P., 2017. Why Britain Voted for Brexit: an individual-level analysis of the 2016 referendum vote. Parliamentary Affairs, 70(3), pp.439-464.
Dhingra, S., Ottaviano, G.I., Sampson, T. and Reenen, J.V., 2016. The consequences of Brexit for U.K. trade and living standards.
Henderson, A., Jeffery, C., Wincott, D. and Wyn Jones, R., 2017. How Brexit was made in England. The British Journal of Politics and International Relations, 19(4), pp.631-646.
Hobolt, S.B., 2016. The Brexit vote: a divided nation, a divided continent. Journal of European Public Policy, 23(9), pp.1259-1277.
Matti, J. and Zhou, Y., 2017. The political economy of Brexit: Explaining the vote. Applied Economics Letters, 24(16), pp.1131-1134.
Tilford, S., 2015. Britain, immigration and Brexit. CER Bulletin, 30, pp.64-162.